
Sharper Reports, Better Decisions: Connecting The Dots From Digital Data To Business Outcomes
Published by Daniel A. Dahlen on
In last week’s post I mentioned how the amount of data and metrics can often feel overwhelming for many small business owners.
This can be true in almost any area of a business, but especially so in the digital marketing world where nearly every action can be automatically recorded, aggregated and stored over time that can give small business owners insight into their digital representation and efforts.
Quite frankly, many of those digital data points or metrics can often be overkill for most small business owners; just because you have data, doesn’t always mean that it’s meaningful or drives eventual outcomes.
The more metrics you track, the more complexity for collecting, cleaning, filtering and presenting that data — this can lead to reporting that can feel “heavy” and ultimately confusing, without easy/simple ways to pull that information.
Cumbersome reporting – and reports that include too many (or irrelevant) metrics aren’t really helpful.
In recent years, with the rise of AI agents and bot activity online, digital data has gotten more “noisy”, I would describe, further conflating the reporting mechanisms on many digital platforms.
So what can you, a small business owner, do to sift through the “noise” and actually connect the dots from digital data to business outcomes?
Working Backward From Business Outcomes
As with any business, you want to start with your business outcomes – revenue, profit, growth/stability and work backwards (working backwards is actually deployed in formal mathematics proofs for those interested) to see what the most important metrics are that help drive those outcomes.
These business outcomes are often referenced as financial in nature (revenue and profit must be something every small business owner should be tracking), but other (more qualitative) can also be used here.
As mentioned last week, your business outcome numbers don’t always tell the full story, but without them you won’t have the full story – which can give you an aimless or unsettling feeling, without full view of these “harder” numbers.
Whatever outcomes you want from your small business, make sure they’re easily (and frequently) measured over time.
Impact Metrics That Drive Business Outcomes
With your business outcome metrics in hand, now you can start looking at metrics that directly impact those outcomes.
For many small businesses I work with, these are often metrics on projects and bookings. As the volume of projects and bookings increases, so too, do the business outcomes – revenue and profit, in particular.
For others, it could be project size or type — projects that exceed some scope in work to be performed or projects of a particular category that drive more revenue and profit.
Ideally, the “impact” metrics should only be a few in total (perhaps, even just one in some cases), but should be a quick way to say this formula:
We increased this [impact metric] which lead to an increase in [business outcome metrics] over [some time period].
Just like any metric space within your small business, there are endless levels of complexity you can add to get more insight into which metrics are actual impact metrics.
If you’re just starting out, however, it’s usually best to just focus on a few, simple (and logical) metrics so you can measure other “upstream” digital metrics (see below) that lead to improving those core impact metrics.
Performance Metrics That Drive Impact Metrics
With your business outcome metrics at hand, and the core impact metrics that drive those outcomes you can now move toward more performance level metrics that help drive your impact metrics.
These are often “pipeline” level metrics (tied to your sales pipeline) – calls, form entries, leads, lead conversion rate, qualified leads, estimates/proposals, booking/sales conversion rate – among many others.
What’s important here is the connection to your core “impact” metrics. An increase in qualified leads [performance metric], should lead to more estimates [another performance metric], which leads to more projects/bookings [impact metric] – increasing your revenue/profit [business outcome metric].
Often these metrics can be segmented by different sales stages, but the important step here is how they’re connecting to your ultimate business outcomes – via your impact metric.
Surface Metrics That Drive Performance Metrics
This level of metrics are where things can get even more complex – especially with digital data (and the aforementioned AI agent and bot activity that can skew/inflate certain metrics), but again, often you’ll find a small subset of metrics that are associated with driving your performance level metrics.
If you know that more traffic from search (with stronger, more robust/consistent positioning) to your website meant more calls and leads, that might be a good choice as a surface metric.
If you know that increasing your following on social media lead to more social traffic to your website and meant more form entries, calls/leads, that could also be a great surface metric.
Again these metrics can be as simple or complex as you’d like them to be, but often there can be just a few surface metrics that can drive your performance metrics, and in-turn, your impact metrics and finally your business outcome metrics.
Tactical Level Metrics That Drive Surface Metrics
This is the final level of metrics — tactical metrics that drive your surface metrics.
These metrics are almost more diagnostic in nature — perhaps you’ve noticed a piece of content receiving less search traffic or certain social media posts aren’t performing as well.
Often looking at these tactical level metrics will help you diagnose changes (positive, neutral or negative) in your surface level metrics, essentially.
These will ultimately result identifying if any changes in digital tactics need to be made to continue driving your surface level metrics, which drive your performance metrics, which drive your impact metrics and ultimately your business outcome metrics.
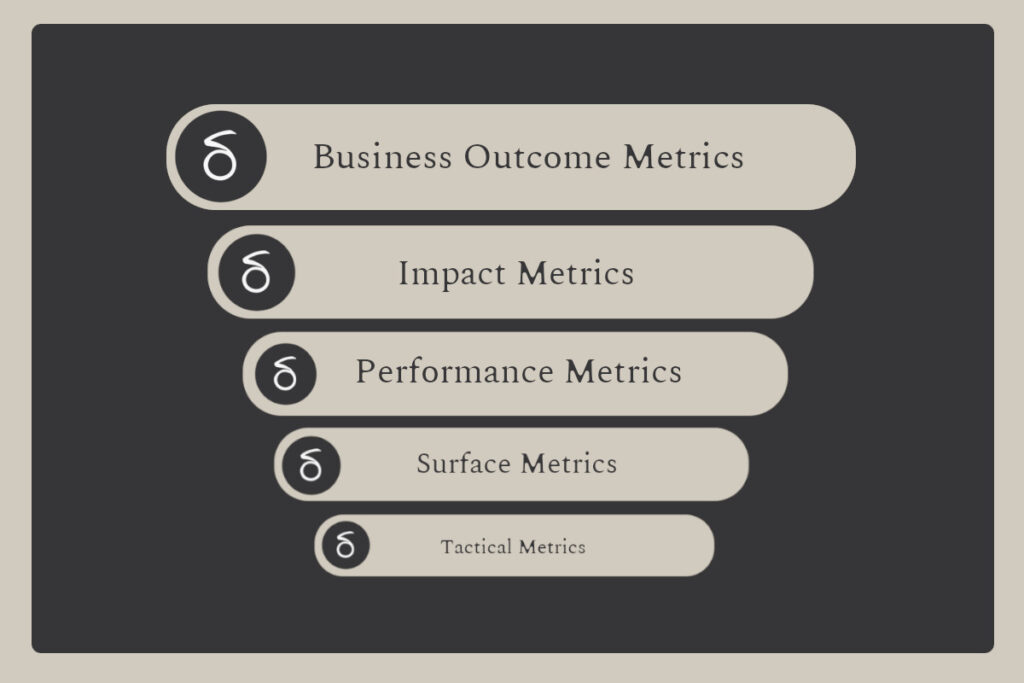
Tactical metrics drive surface metrics.
Surface metrics drive performance metrics.
Performance metrics drive impact metrics.
Impact metrics drive business outcomes.
Combine all of these together, you’ve got a really nice chain of metrics that can help drive your overall small business strategy – and help you connect the dots from your digital efforts down to your ultimate small business goals.
Pulling Everything Together: Reporting & Report Frequency
Once you’ve defined your metric set, now you can pull them together into more formal reports or dashboards for your small business.
In the digital era, it’s quite easy to track almost any of these metrics on a daily basis but in reality dropping some of those reports into weekly, monthly, quarterly or annual reporting can be more beneficial.
For example, if you see that one particular social media post (tactical metric) didn’t perform very well, is that one poor post enough to draw the conclusion that it had an impact on higher level metrics? In most cases it’s unlikely so getting a daily report on those could be overkill; perhaps a weekly or monthly report might be better.
Obviously, if you have more longer-term plans for your small business in mind, that will affect how frequently you might want reports from different levels of metrics as well.
Maybe you’ll only need to check-in on your impact metrics once or twice a year to understand how they’re affected by your performance level metrics are over that time.
Perhaps you only need quarterly reporting for your performance level metrics to gauge your surface level metric effectiveness.
Perhaps you only need monthly reports of your surface level metrics to understand how effective your tactical metrics influence them.
And maybe you want to keep weekly tabs on your tactical metrics to see how your individual digital tactics are performing.
Again, it’s not hard these days to track any or all of these as frequently as you might want them, but the idea is to monitor how each metric of each layer – given ample time – has an effect on the upstream, more important metrics.
Small Changes, Big Results
Perhaps a mantra of Small Business Sidekick over the years, but as you evaluate your reports you’ll be able to see how very small changes (or deltas) in different areas of your digital marketing efforts can cascade through and amplify & improve the eventual business outcomes.
For example, a small position change ( or reposition ) in search (tactical level metric) lead to a 10% increase in search traffic (surface metric) during one particular month, which lead to an increase of 10% more leads from search, 10% more estimates (performance metrics) and 10% more booking/projects (impact metric) in some month.
Doing some quick math on that – if you were doing 40 projects a month at $10,000 per project and $5,000 in profit per project ($400,000 total per month at $200,000 in profit), that small change in search position lead to an extra 4 projects per month – an extra $40,000 in revenue and $20,000 in profit added to your business outcome metrics for that month.
This is an overly simplified example (often different metrics affect each other in different ways and aren’t always that smooth), but it illustrates how very small changes in lower-level, tactical metrics can cascade upward and improve the outcomes of your small business.
It also allows you to identify the different metrics at each level that you might want to include in a weekly, monthly, quarterly or annual report.
So, in the age of endless information and data – what specific metrics do you need to see at each level to fully understand the impact of your digital marketing efforts?

